Interface
Structure
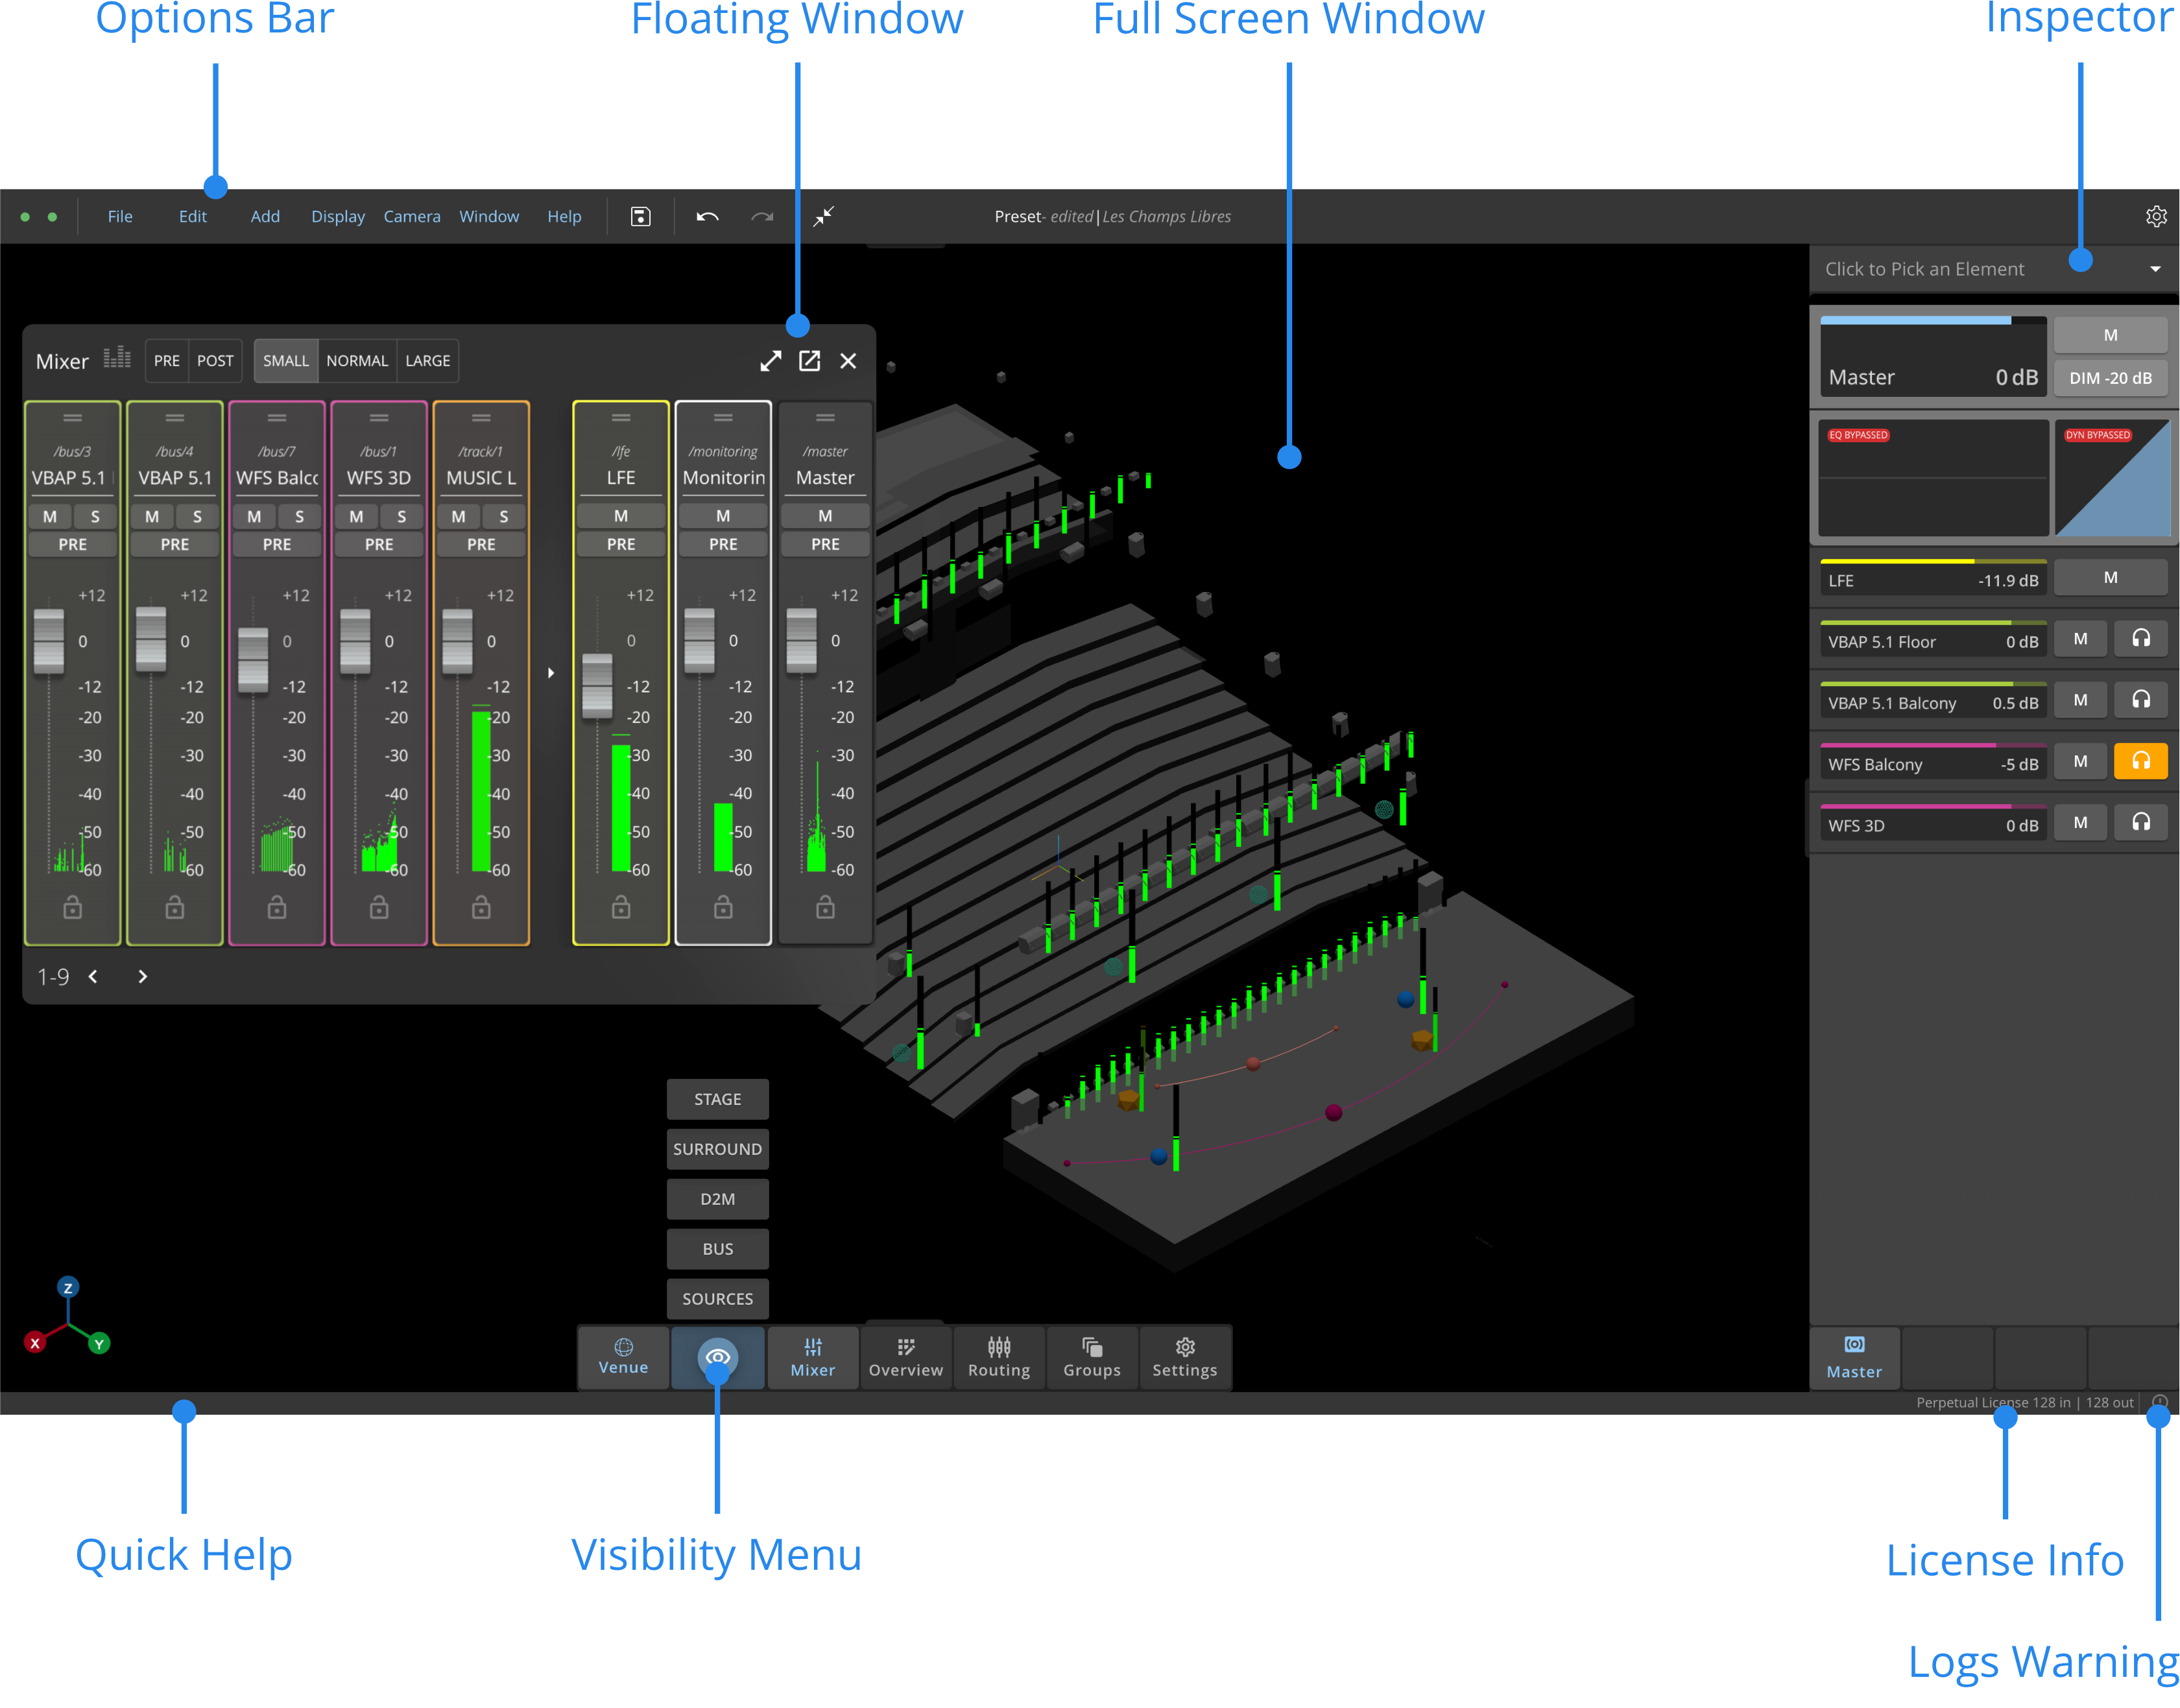
Navigation
Located on the right-hand side of the interface, the Inspector allows you to display various elements using one of the following options :
- Use the dropdown menu
- Use the search bar to find objects by their Name or OSC Address
- Select the objects in the Venue, Mixer or Overview
- Use the navigation arrows to select the previous or the next element in the inspector's list
- You can select multiple elements by maintaining the Shift key pressed.
Dock
What is the Dock?
Since HOLOPHONIX 2.2, we introduce the Dock to improve your workflow. This replaces the Window menu in previous versions.
Located at the bottom of the Interface, the Dock is a convenient way to access the different windows of HOLOPHONIX.
- You can toggle the display of the Venue, Groups, Mixer, Overview, Routing and Settings windows as you click on the different sections of the Dock.
- When windows are displayed in full-screen, the Dock will incorporate the relevant Window’s tabs.
Visibility Menu
Since HOLOPHONIX 2.2, we introduce the Visibility Menu menu. Located in the dock, it acts as a filter to perform “visual solo” in both the Mixer and the Venue. As you hover over it, the menu will list all of the groups and categories for which you can toggle the visibility on or off.
How it works
The visibility menu is a useful tool to quickly visualize relevant groups and categories.
- In the Venue window, it acts as a filter to display specific virtual source groups.
- In the Mixer window, it acts as a filter to display both source groups and various global categories (Source, Bus). The filter selection is linked to both the Venue and the Mixer windows.
If you choose to display one group in the Venue, the Mixer will display this group only. As buses, Direct to Master and Ambisonics sources are not physically visible in the Venue, you can only filter them in the Mixer.
Selecting a group or category to display will not apply a solo to its signal. It will only single it out visually in the Venue and/or Mixer.
Quick Help
The Quick Info section displays information about any preset parameter when hovering over it. When available, the OSC command of the parameter will be shown.
Each parameter is also associated to a quick link. Hover over any parameter in the inspector for a few seconds, and a light bulb will appear. Click on it to access the corresponding documentation section.
Processor Status Monitoring
The color dots on the right of the quick info bar offers information about the HOLOPHONIX processor status.
Network Status
The leftmost dot shows the network status. Click on the dot to monitor the network load, indicated by the number of network frames exchanged at time t.
It is green under normal circumstances, and red when the network connection with the processor is lost.
Audio Engine & CPU Status
The rightmost dot indicates the Audio Engine status. Click on the dot to monitor the CPU load used by the audio engine, in %.
It is green under normal circumstances, orange with high CPU loads, and red in case of an audio engine error.
It is recommended not to exceed 50%.
Please note that the this dot indicates CPU load if you are using HOLOPHONIX Native. If you are using a HOLOPHONIX processor, you are not using the processor's GPU processing power. Therefore, this lower dot would indicate DSP load.
Logs Warning
Whenever some information is printed out on the logs (due to an error or a wrong configuration), the logs warning icon will turn red. Click on it to display the logs and learn more about the error. Refer to the Logs Settings for more details.
If you want to share the logs with other users or support, you can download them as a text file.